
Actualité volcanique, Articles de fond sur étude de volcan, tectonique, récits et photos de voyage
Par Bernard Duyck

Holuhraun - 02.09.2014 - dégagement de gaz volcanique sur la fissure active - photo RUV
L’éruption fissurale Bardarbunga-Veidivötn de 2014-15 à Holuhraun en Islande a produit 1,5 km³ de lave, qui a recouvert une surface de 86 km² environ, ce qui en fait la plus importante éruption de ce pays en plus de 200 ans. Les émissions journalières de dioxyde de soufre ont dépassé toutes les émissions d’origine humaine en Europe durant l’année 2010 d’un facteur au moins égal à 3.

Holuhraun - Dégazage du lac de lave sur la fissure active 21.01.2015 - photo Dr. Anja Schmidt / Twitter
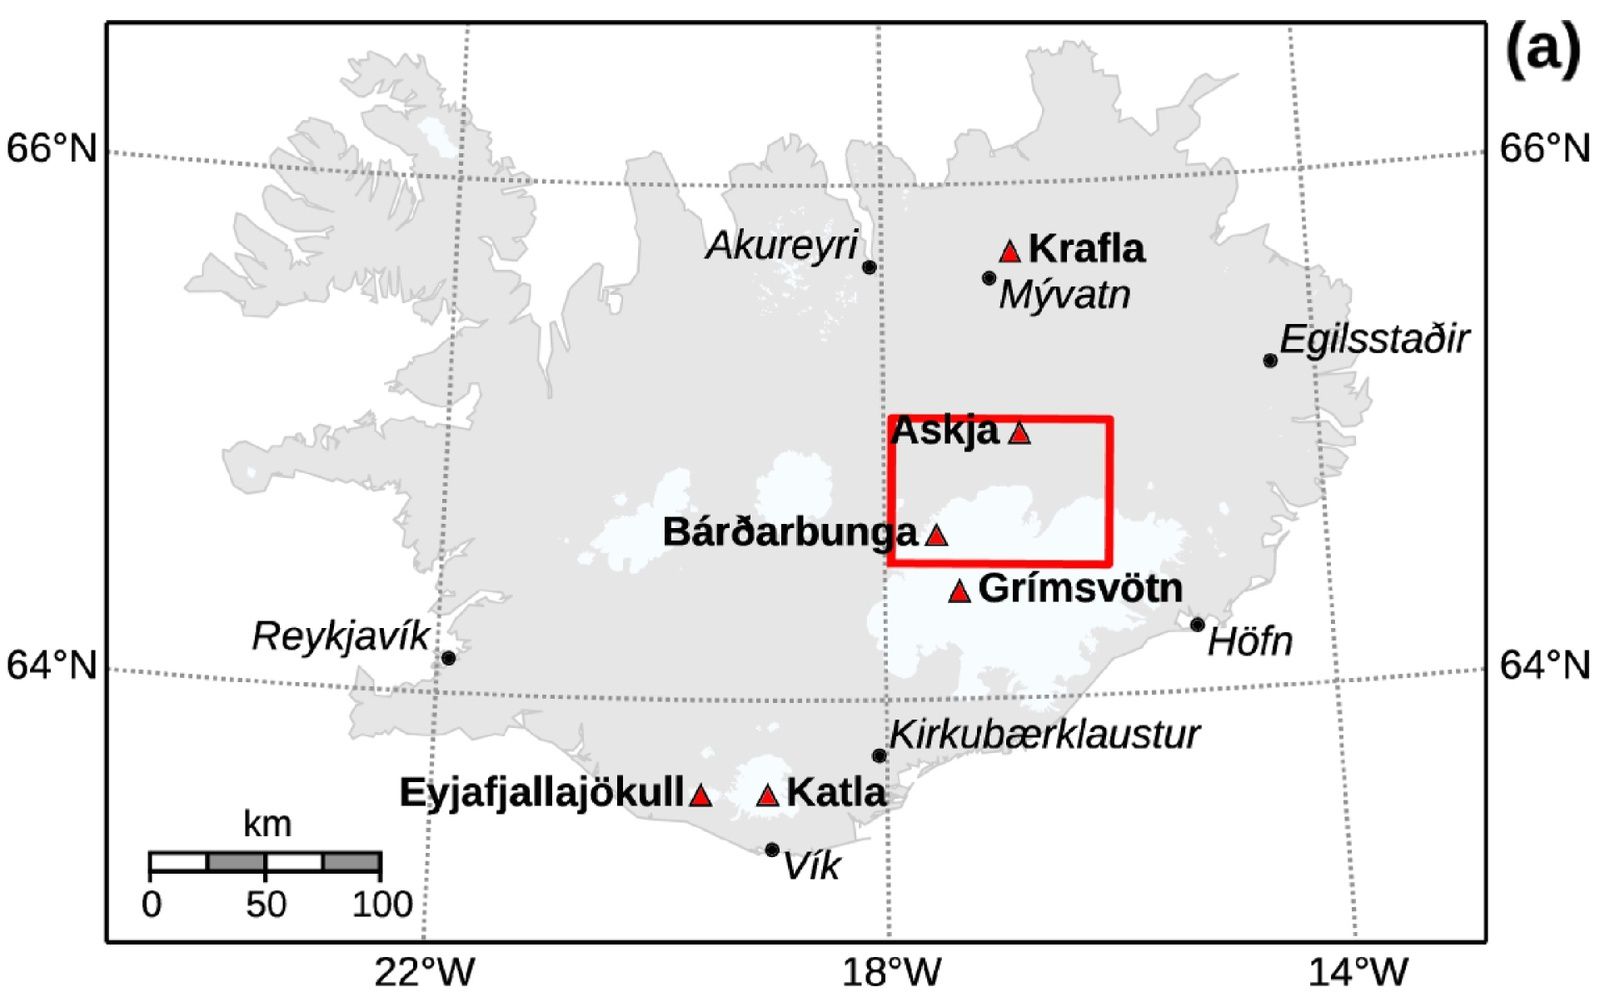
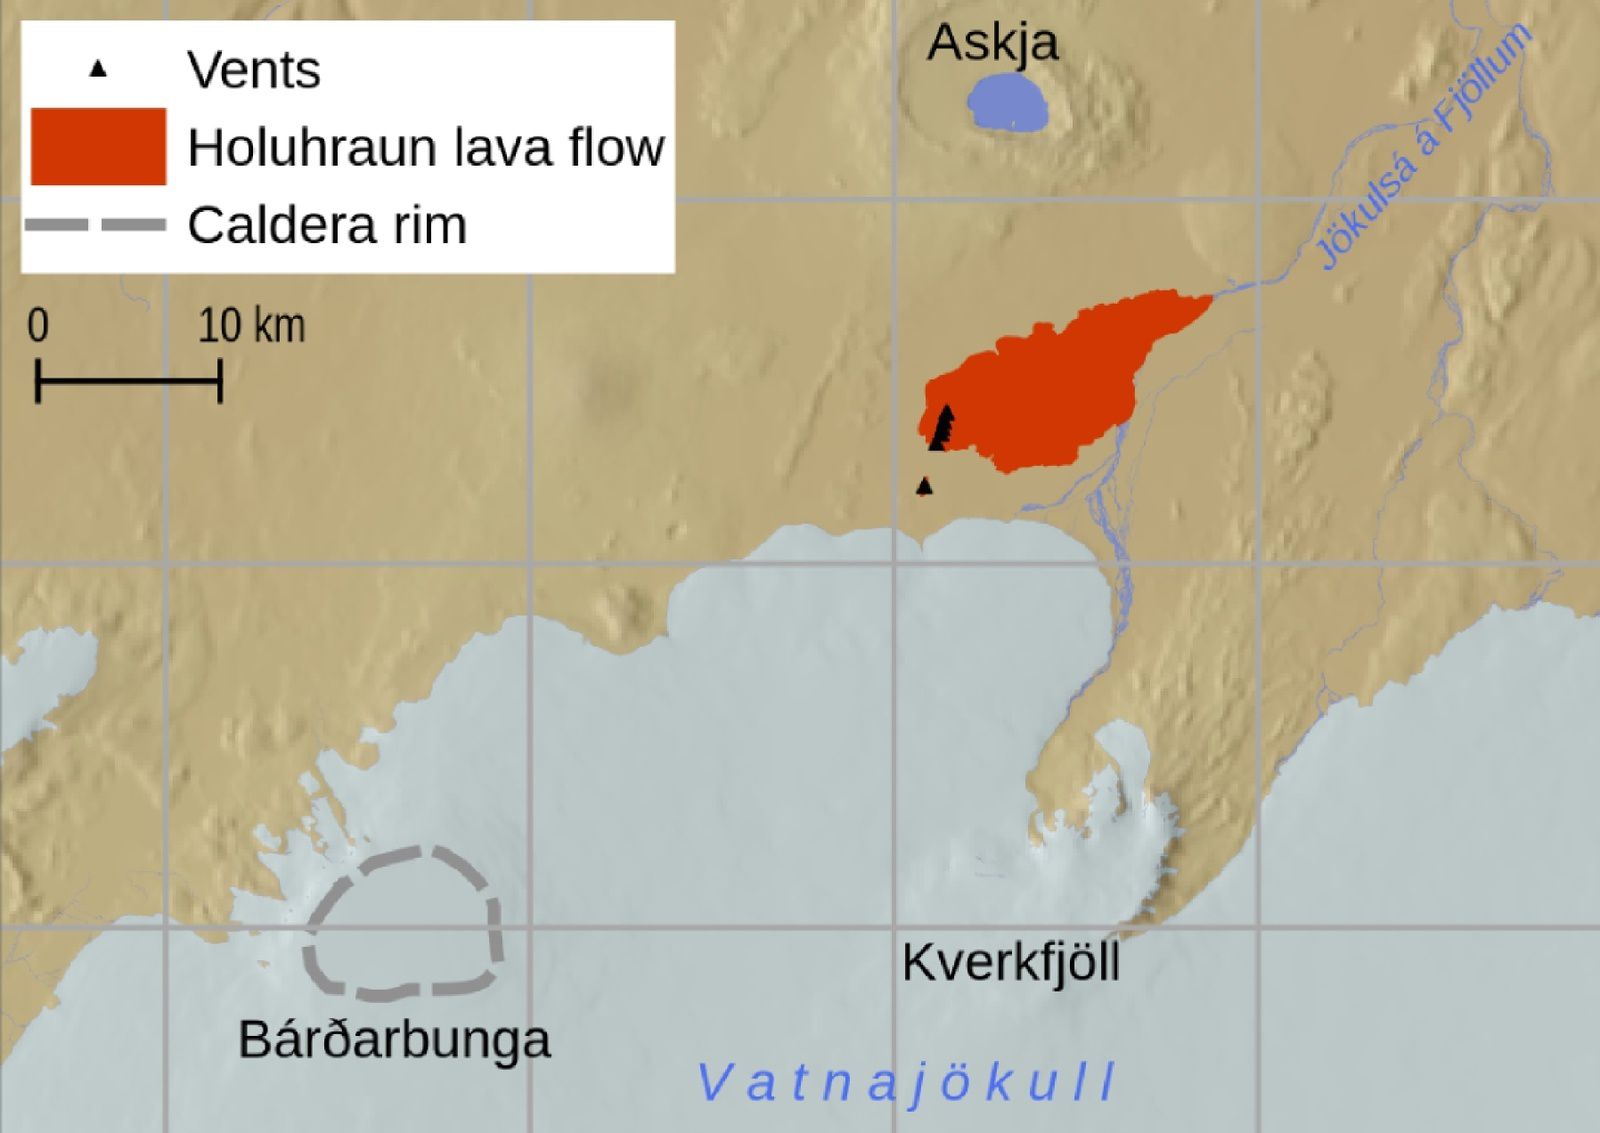
Overview of the 2014–2015 eruption at Holuhraun showing (a) the locations of the Icelandic towns and volcanoes, including the Bárðarbunga-Veiðivötn volcanic system. The red rectangle outlines the region shown in Figure 1b. (b) Map showing the Bárðarbunga caldera (dashed gray line) and the lava flow field and vents of the 2014–2015 eruption. The extent of the lava flow was digitized from a SENTINEL radar image produced by the University of Iceland. Vent locations have been drawn from Operational Land Imager (on Landsat 8) acquired on 6 September 2014 - doc. Dr.Anja Schmidt & al réf en sources
Les observations de l’étude publiée le 23 septembre 2015 dans le Journal of Geophysical Research, du Dr. Anja Schmidt et ses collègues (réf. en sources), présentent les observations pour septembre 2014 de la qualité de l’air pour l’Europe du nord, à la fois d’après les données satellitaires et le modèle de simulation du SO2 volcanique du Met Office. Au cours de ce mois, un total de 2,0+/-0,6 millions de tonnes de SO2 ont été émis par l’éruption … à titre de comparaison, l’éruption du Laki en 1783-84 a produit en 8 mois 60 fois plus de dioxyde de soufre et interféré avec le climat Européen du milieu des années 1780.
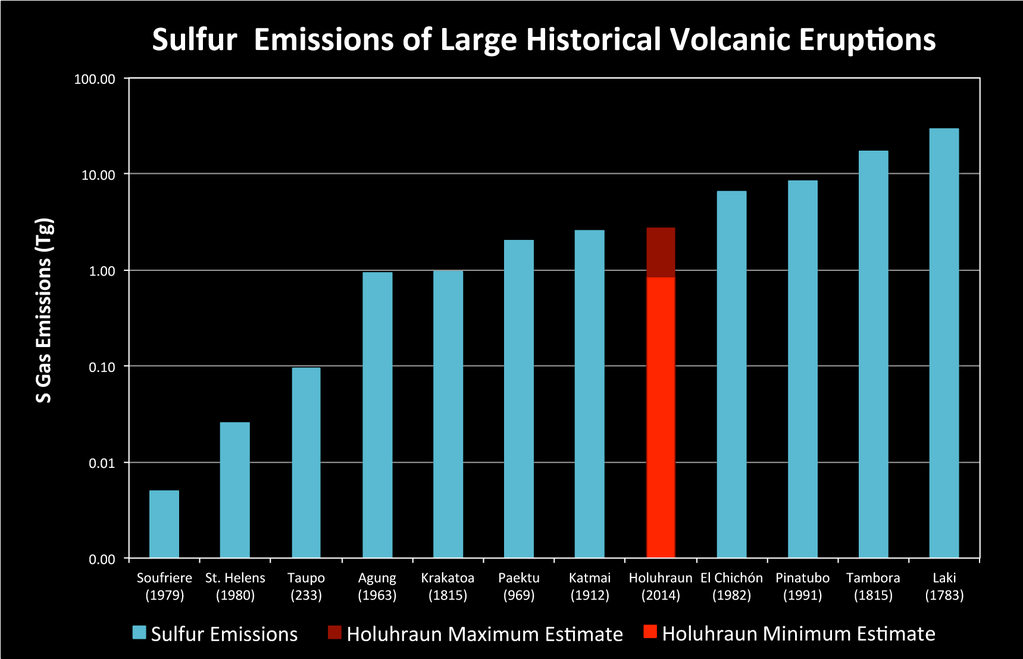
Emissions de dioxyde de soufre à Holuhraun par rapport à d'autres éruptions historiques ( l'échelle est logarithmique )- Doc. volcanofiles 11.12.2014 - pic.twitter.com-wONcesfRXO
L’étude a montré que le SO2 a été transporté sur de longues distances et détecté dans des stations de contrôle à plus de 2.750 km de l’Islande. Ces observations et les modèles ont démontré que la pollution d’origine volcanique de cette éruption islandaise fissurale peut toucher le nord de l’Europe et en dégrader temporairement la qualité de l’air.
L’étude fait remarquer également que le nombre de stations de monitoring de SO2 en Europe est trop bas, résultat depuis les années 1980 d’une réduction imposée des émissions d’origine humaine … et insuffisant en cas de répétition future d’une éruption de type Laki.
![Maximum 1 h mean sulfur dioxide (SO2) mass concentrations (µg/m3) measured at the surface during September 2014 at air quality monitoring stations across Northern Europe (see also Table 2). Circles denote that these peak concentrations occurred between 4 and 9 September 2014, triangles denote the period 18–25 September 2014, and squares denote any other date in September 2014. The concentrations are color coded using the United Kingdom Department for Environment, Food and Rural Affairs (DEFRA) air quality index warning levels for 15 min mean SO2 concentrations with green = low pollution levels, orange = moderate pollution levels, and pink = high pollution levels, and dark red and violet = very high and hazardous pollution levels [Connolly et al., 2013]. Note that at times, in Iceland higher SO2 mass concentrations have been measured after September 2014, which are not shown. - doc. Dr.Anja Schmidt & al réf en sources](http://img.over-blog-kiwi.com/0/93/55/25/20150925/ob_2394a0_jgrd52435-fig-0002-553x280.jpg)
Maximum 1 h mean sulfur dioxide (SO2) mass concentrations (µg/m3) measured at the surface during September 2014 at air quality monitoring stations across Northern Europe (see also Table 2). Circles denote that these peak concentrations occurred between 4 and 9 September 2014, triangles denote the period 18–25 September 2014, and squares denote any other date in September 2014. The concentrations are color coded using the United Kingdom Department for Environment, Food and Rural Affairs (DEFRA) air quality index warning levels for 15 min mean SO2 concentrations with green = low pollution levels, orange = moderate pollution levels, and pink = high pollution levels, and dark red and violet = very high and hazardous pollution levels [Connolly et al., 2013]. Note that at times, in Iceland higher SO2 mass concentrations have been measured after September 2014, which are not shown. - doc. Dr.Anja Schmidt & al réf en sources
Source :
Satellite detection, long-range transport, and air quality impacts of volcanic sulfur dioxide from the 2014–2015 flood lava eruption at Bárðarbunga (Iceland) J. Geophys. Res. Atmos., 120, doi:10.1002/2015JD023638.
Anja Schmidt,Susan Leadbetter, Nicolas Theys, Elisa Carboni, Claire S. Witham, John A. Stevenson, Cathryn E. Birch, Thorvaldur Thordarson,Steven Turnock, Sara Barsotti, Lin Delaney, Wuhu Feng, Roy G. Grainger, Matthew C. Hort, Ármann Höskuldsson, Iolanda Ialongo, Evgenia Ilyinskaya, Thorsteinn Jóhannsson, Patrick Kenny, Tamsin A. Mather, Nigel A. D. Richards, Janet Shepherd
Thème Magazine - Hébergé par Overblog


/image%2F0935525%2F20221031%2Fob_614820_2022-10-30-18h33-wit-gunung-ibu-p.jpg)
/https%3A%2F%2Fi.ytimg.com%2Fvi%2FoOCJ-5qxdO8%2Fhqdefault.jpg)
/image%2F0935525%2F20221029%2Fob_ff7a2c_2022-02-28-22h06-utc-pavlof-sat-wor.png)
/image%2F0935525%2F20221028%2Fob_fb9420_2022-10-26-survol-du-cotopaxi-par-le-f.jpg)